|
4/28/2022 0 Comments Map, Illustrations, and QR codesThis is my final day working on the Nature Trail Project. I added the last illustrations to the website, brochure, and print copy that will accompany the QR codes. From the January start up to today, I have logged 119. 3 hours. (Last week, I estimated it would take 117-119 hours.) Finals have started and I am over the 98 hours agreed to for the assistantship project. I really enjoyed working on the illustrations and developing the map and brochure. It was a fun project, so I don't mind that I went over the time limit. I have left information for the next student who might like to pick up where I left off. There are many species in the iNaturalist observations that could still be added. I wanted to expand the project to include plant communities and spend more time on the map, but this could be a great learning opportunity for another ENVL student. There are 1,600 acres on campus, so there are many possibilities for splitting up the map data into smaller segments, designating trails for certain uses, and displaying the maps in different areas. I may have gone overboard trying to find every single trail, but this is useful information for faculty planning projects, the forest management plan, and emergency services. Many of the longer trails in the southern part of campus are used by student athletes and other passive recreation, so I hope members of the Stockton Community can benefit from the trail map. I am really glad that I was able to work on this project. My GIS skills have improved and I learned to make faster accurate drawings. Most things went according to the plan, but I did not have leaves for two of the species so I worked from digital herbarium specimens. I originally thought I could do 10 more species, so this gave me a more realistic perspective on what I can accomplish in a semester. I hope this project continues to grow and that future students will have more to add. Here is the final map produced for this project: 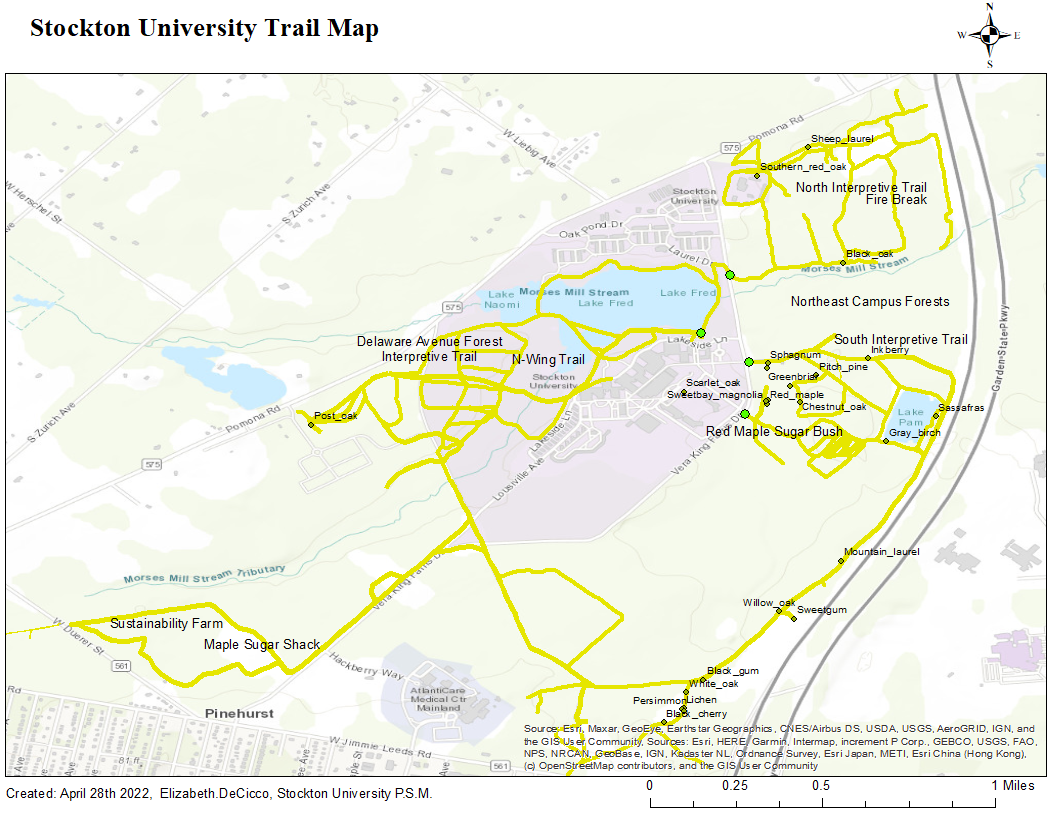
0 Comments
4/16/2022 0 Comments Developing the MapOver the last few weeks, I have been recording more trail data with my GPS unit. I just finished uploading some new segments (second map, in green) to see what I might have missed. I have almost every trail shown in the old map for the N-Wing/Delaware Interpretive trail. There are still some lines that need to be cleaned up, but I will wait to do that from a campus computer. Delaware Avenue has a main trail with many firebreaks extending from it, marked with flagging. I relied on my GPS to check which firebreaks I had already recorded and I was pretty sure that I covered every firebreak that looked clear. Compared to the Delaware Avenue Map in the Forest Management Plan, I don't have as many segments. I would like to revisit the Sustainability Farm and the west side of the Delaware Avenue trail, see if there is a trail around Lake Naomi, and fill in some of the gaps around the South Interpretive Trail. After some editing, trail measuring, and labeling, the map should be finished. Uploading data to ArcMap: I convert the data to a .CSV, edit the columns as needed, and add the data to ArcMap. The data needs to be converted again to XY data, which gives me a layer with points. The points are then converted to lines. Additional corrections needed: edit scale bar, add names and descriptions, measure trail distances 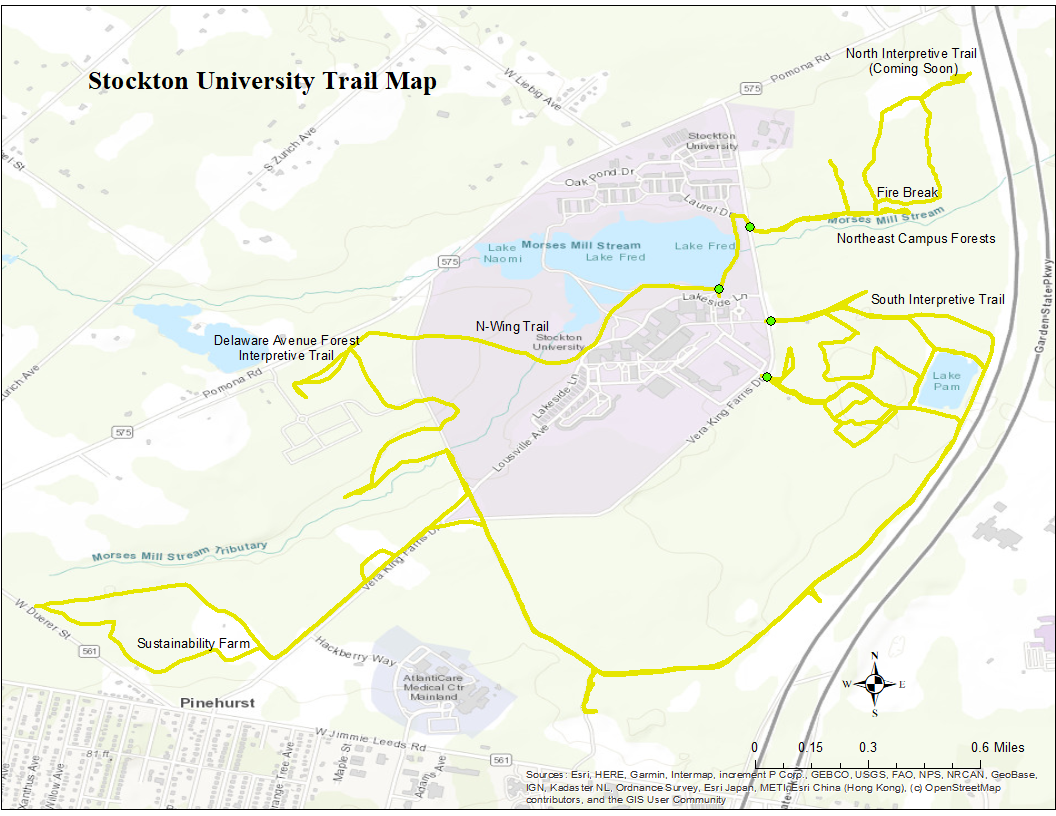 Map as of March 2022 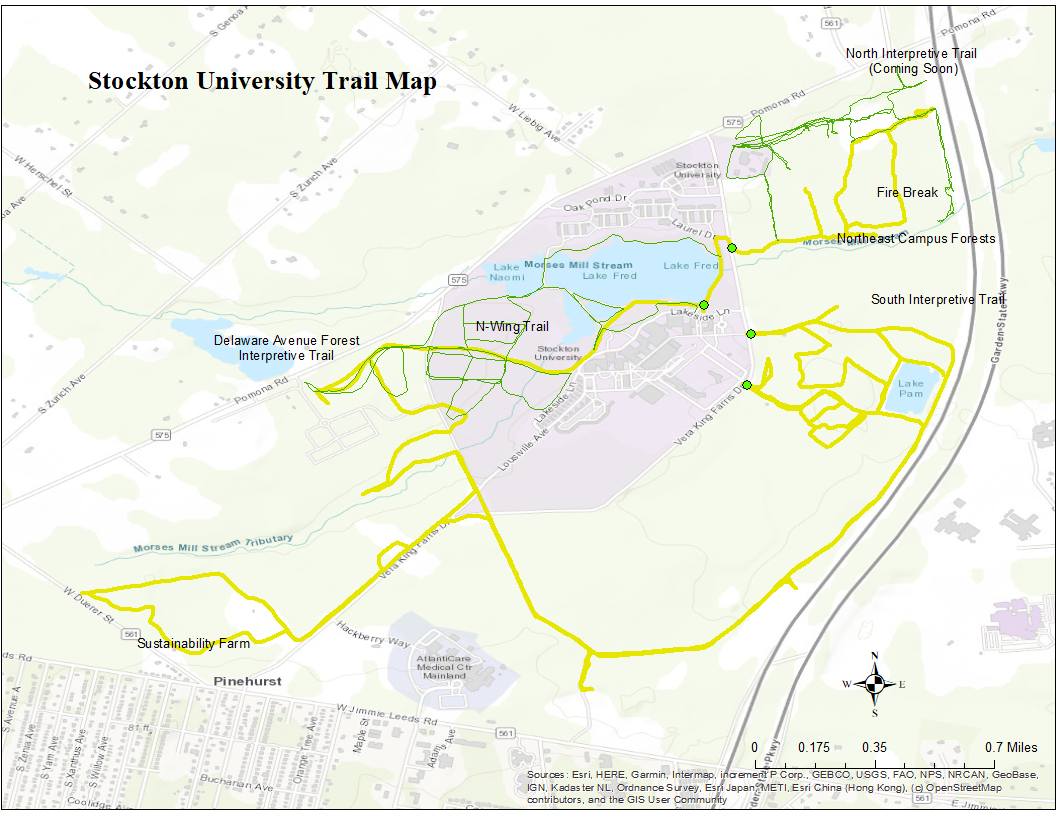 Map as of April 16th 2022 With one month left to complete this project, I would like to use this space to share some of the process of putting this project together.
Last semester, I applied for a Graduate Assistantship. I wasn't sure what my project would be, so I spoke to several different professors about projects that would benefit the ENVL department or research that I could assist with. My advisor came up with the idea for the Nature Trail project. Knowing that the project would start in January, I started collecting leaves in November 2021 while they were still fresh. In January, my advisor and I met to discuss QR codes, a website, and trail map as the final deliverables. It was an especially cold month, and I recorded the first segment of trails with my GPS when it was less than 20 degrees outside. Between January and February, I started worked on illustrations from the leaves I collected in the Fall and some very crumbly winter collections. I researched QR codes, set up the website, and learned how to transfer my data to ArcMap. When I recorded trail data, I also stopped to take photos for iNaturalist. Species lists are usually developed with voucher specimens sent to an herbarium. Each specimen has a description with location, scientific name, collector's name, and associated species. iNaturalist can effectively store the same amount of data without a pressed specimen to serve as a voucher. By comparison, iNaturalist takes far less time than traditional methods of recording species lists. For this project, using iNaturalist gave me a way to record all of that data more accessibly. This new database for collections on Stockton's campus can help in the forest management plan, students looking for a specific habitat type, or anyone curious about biodiversity on campus. This is a database that can continue to expand overtime. After the extreme winter weather started to break, I sped up the trail mapping process by attaching the GPS unit to my bike. I could collect data in half the time and the resulting trail data had cleaner lines. If I needed to go slightly off trail for an iNaturalist observation, I could leave the bike in position so the GPS unit wouldn't be effected. On weeks where I collected trail data, I would often record 2-5 hours in one day for that week. iNaturalist observations were factored into this time, with some additional time spent at home editing species names. I was trying to balance my time so each deliverable was getting some progress each week. If the weather was really bad, I might only work on illustrations and research. Illustrations were done in batches of line drawings, then transferred to a new sheet of paper and inked. I learned this process in the NYBG certificate program. Drawings were inked with a Rapidograph, cleaned with a kneaded eraser, and scanned. Once scanned, I removed the white background of the paper so the images would be transparent. As an estimate, an individual drawing took about 45 minutes for a pencil drawing, 45 minutes for a final pen & ink, and 5-10 minutes for editing, depending on complexity. Each week, I needed to devote 7 hours to the project. In March, I started going slightly over the time limit and I might finish the project early. The last few weeks will be a challenge to plan ahead, because the project deliverables need to be printed and displayed. I have gotten in touch with the University's media department to discuss printing options and share the project with the Biodiversity Committee for approval. At this point, everything still needs a little more work. Extra time permitting, I will continue to add more content to the website. Last semester, I took Project Management and learned how to schedule milestones. I think it helped me tackle this project and balance my time. I also had my first GIS course in the Fall, so that prepared me for developing the map. If I had to do a similar project again, I would start in the Fall so there would be more plant data available and better specimens to draw from. I might have changed the milestones so the last month and a half was entirely digital work-- map-making, website development, and content creating. |
AuthorWrite something about yourself. No need to be fancy, just an overview. ArchivesCategories |
 RSS Feed
